6) Efecto del Blending en la descarbonizacion de la red de gas natural
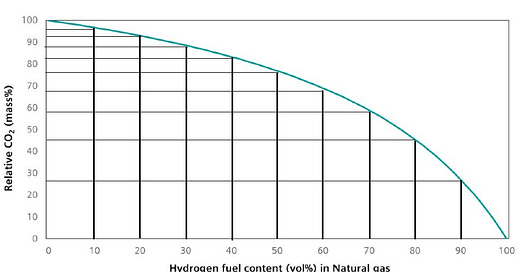
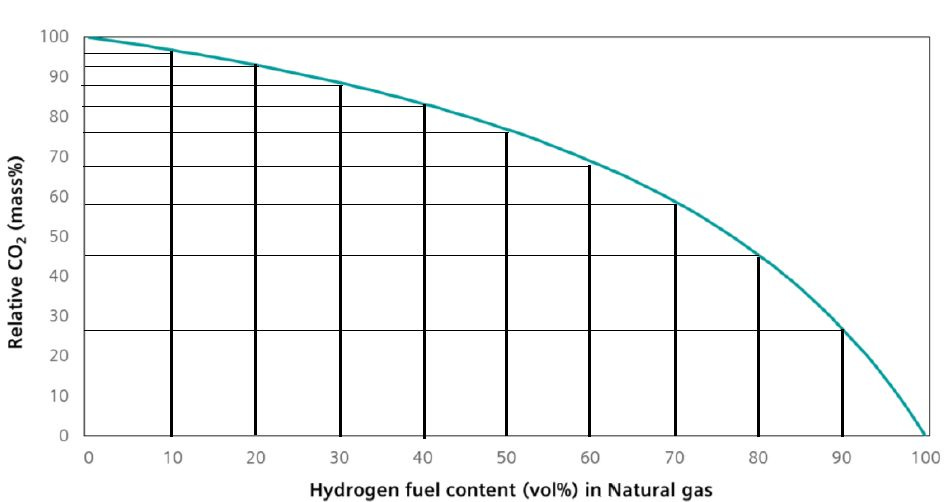
Aquí podéis observar el 𝐞𝐟𝐞𝐜𝐭𝐨 𝐪𝐮𝐞 𝐭𝐢𝐞𝐧𝐞 𝐢𝐧𝐲𝐞𝐜𝐭𝐚𝐫 𝐡𝐢𝐝𝐫ó𝐠𝐞𝐧𝐨 𝐚 𝐥𝐚 𝐫𝐞𝐝 𝐝𝐞 𝐝𝐢𝐬𝐭𝐫𝐢𝐛𝐮𝐜𝐢ó𝐧 𝐝𝐞 𝐠𝐚𝐬 𝐧𝐚𝐭𝐮𝐫𝐚𝐥 con intención de reducir la huella de carbono del gas natural. (El denominado Blending de hidrógeno).
Vol H₂-GN (%) Reducción emisiones CO₂ (%)
10 4
20 8
30 12
40 16
50 25
60 32
70 42
80 55
90 72
100 100
¿Cuáles son los motivos para que el gráfico tenga esa tendencia?
El hidrógeno tiene una 𝐝𝐞𝐧𝐬𝐢𝐝𝐚𝐝 𝐝𝐞 𝐞𝐧𝐞𝐫𝐠í𝐚 𝐯𝐨𝐥𝐮𝐦é𝐭𝐫𝐢𝐜𝐚 que es aproximadamente un tercio de la del metano (el CH₄ es el compuesto mayoritario del gas natural ).
Por lo tanto, al considerar una mezcla de gases teniendo en cuenta la participación energética, es decir, considerando la parte del poder calorífico del hidrógeno, la parte del hidrógeno es mucho menor, y también lo son los potenciales ahorros de emisiones de CO₂ asociados a la misma.
Para lograr una reducción del 50 % en las emisiones de CO₂ por masa, se necesita aproximadamente un 80 % en volumen de contenido de hidrógeno en el combustible. La normativa español actual (BOE-A-2013-185 y BOE-A-2018-14557. Normas de la gestión técnica del sistema NG-TS06 y NG-TS07 y los protocolos de detalles PD-01 y PD-02) limita al 5 % en volumen de H₂, mezclado con gases no convencionales, donde iría incluido el hidrógeno.
Un 𝒑𝒓𝒐𝒃𝒍𝒆𝒎𝒂 𝒔𝒆𝒄𝒖𝒏𝒅𝒂𝒓𝒊𝒐 que puede aparecer:
Un sistema de gas típico puede manejar alrededor de 3 a 4 horas de demanda promedio simplemente usando el gas almacenado en las redes de distribución. Técnicamente a esa cantidad de gas natural se le denomina "𝐋𝐢𝐧𝐞 𝐩𝐚𝐜𝐤".
En un hipotético caso de 100% de blending de hidrógeno supondría reducir el "Line pack" a 1h, dado que el hidrógeno dispone de una menor densidad de energía por volumen (1/3 respecto al gas natural). Resumiendo, las tuberías actuales no podrán gestionar la misma demanda de energía que actualmente es suministrada por gas natural. Pudiendo esto significar una gran diferencia en la confiabilidad del sistema de distribución, la frecuencia y duración de las interrupciones.
Gráfico de "Hydrogen power with Siemens gas turbines: Reliable carbon-free power with flexibility" de Siemens Gas and Power GmbH & Co. KG (2020), modificado por Ager Prieto Elorduy.
6) Effect of Blending on the decarbonization of the natural gas network
Here you can see the effect of injecting hydrogen into the natural gas distribution network with the intention of reducing the carbon footprint of natural gas. (The so-called hydrogen blending).
Vol H₂-GN (%) CO₂ emissions reduction (%)
10 4
20 8
30 12
40 16
50 25
60 32
70 42
80 55
90 72
100 100
What are the reasons for the graph to have this trend?
Hydrogen has a volumetric energy density that is approximately one third that of methane (CH₄ is the major compound of natural gas). Therefore, when considering a mixture of gases taking into account the energy share, that is, considering For the part of the calorific value of hydrogen, the part of hydrogen is much smaller, and so are the potential CO₂ emission savings associated with it.
To achieve a 50% reduction in CO₂ emissions per mass, approximately 80% by volume of hydrogen content is needed in the fuel. The current Spanish regulations (BOE-A-2013-185 and BOE-A-2018-14557. Norms for the technical management of the system NG-TS06 and NG-TS07 and the detail protocols PD-01 and PD-02) limit the 5% by volume of H₂, mixed with unconventional gases, where hydrogen would be included.
A secondary problem that can appear:
A typical gas system can handle around 3-4 hours of average demand simply by using the gas stored in the distribution networks. Technically, that amount of natural gas is called "𝐋𝐢𝐧𝐞 𝐩𝐚𝐜𝐤".
In a hypothetical case of 100% hydrogen blending, it would mean reducing the "Line pack" to 1h, since hydrogen has a lower energy density per volume (1/3 compared to natural gas). In short, current pipelines will not be able to handle the same energy demand that is currently supplied by natural gas. This can mean a big difference in the reliability of the distribution system, the frequency and duration of interruptions.
Graph from "Hydrogen power with Siemens gas turbines: Reliable carbon-free power with flexibility" by Siemens Gas and Power GmbH & Co. KG (2020), modified by Ager Prieto Elorduy.


